the Creative Commons Attribution 4.0 License.
the Creative Commons Attribution 4.0 License.
 | 27 Jan 2020
Design methodology to determine the water quality monitoring strategy of a surface water treatment plant in the Netherlands
Kim Schagen
Luuk Rietveld
The primary goal of a drinking water company is to produce safe drinking water fulfilling the quality standards defined by national and international guidelines. To ensure the produced drinking water meets the quality standards, the sampling of the drinking water is carried out on a regular (almost daily) basis. It is a dilemma that the operator wishes to have a high probability of detecting a bias while minimizing their measuring effort. In this paper a seven-step design methodology is described which helps to determine a water quality (WQ) monitoring scheme. Besides using soft sensors as surrogate sensors for parameters currently not available online, they can possibly provide a cost-effective alternative when used to determine multiple parameters required through one single instrument.


The primary goal of a drinking water company is to produce safe drinking water fulfilling the quality standards defined by national and international guidelines. To ensure the produced drinking water meets the quality standards, in the Netherlands, the sampling of drinking water is carried out on a regular (almost daily) basis.
Common practice in the Netherlands is that (drinking) water treatment plants (WTPs) are designed in such a robust way that the effluent quality can be guaranteed without direct control on the incoming water quality (WQ) (Vanrolleghem and Lee, 2003; Bosklopper et al., 2004). A WTP consists of several individual treatment steps placed in series, with every treatment step being responsible for the removal (or addition) of certain compounds. All the interactions between the processes ask for an integrated plant-wide approach, optimizing the effluent quality and operational costs (Bosklopper et al., 2004; Nopens et al., 2010).
Van der Helm et al. (2008b) investigated three possible objectives for plant-wide optimization of the operation of existing WTPs and concluded that the objective for integrated optimization should be the improvement of water quality and not a reduction in environmental impact and costs. The effects of these latter two are negligible compared to the environmental impact and costs for the society as a whole when more bottled water is used for drinking water as a result of insufficient (confidence in) tap water quality.
The direct control of water quality becomes more and more important as a result of more stringent criteria and the deterioration of source water (Vanrolleghem and Lee, 2003; van Schagen et al., 2010). Especially WTPs that use surface water as a source experience increased pollution in the form of organic micropollutants and increased organic matter concentrations present in the surface water bodies (Verliefde et al., 2007; Bertelkamp et al., 2014). Besides, this large fluctuations in water temperature and water quality can be noticed, which increases the need for direct control of the WTP.
Nowadays, many WTPs are monitored and controlled by SCADA (Supervisory Control and Data Acquisition) systems (Jansen et al., 1997). The functions of SCADA systems for WTPs include (1) the collection of online measurement data, (2) the surveillance of the measuring chain including operations and (3) process control and other relevant operations (Gunatilaka and Dreher, 2003). Online measurements are the first indicators that give the operators information about the state the plant is in. Besides online measurements, laboratory measurements are taken at a regular interval to check the online measurements and that the produced drinking water meets the quality standards set by national and international guidelines. However, besides the rapid tests performed at the site, the time between sampling and laboratory results takes at least 1 d. This delay in results and interval between measurements makes it difficult to only use the laboratory measurements for real-time control of a treatment plant (van de Ven et al., 2010).
Retrieving reliable and robust online information is therefore important in order to be able to control a WTP. This information can be retrieved from online sensors that measure a specific parameter directly, but it also can be retrieved from generic sensors that give indirect information. Roccaro et al. (2008), Rieger et al. (2004), and van den Broeke et al. (2008) showed the ability of ultraviolet–visible (UV/Vis) spectra measurements, measuring the absorbance of ultraviolet or visible light, to estimate different parameters such as chlorine decay, nitrite and nitrate, ozone, and assimilable organic carbon (AOC) concentrations. These estimations were derived from algorithms based on a change in UV/Vis absorbance during a treatment step and laboratory measurements, using principal component analysis followed by partial least squares regression. These types of generic sensors are so-called soft sensors, sensors that require software to give the required information. Juntunen et al. (2013) developed a soft sensor to predict the turbidity in treated water and to find the most significant variables affecting turbidity.
Optimized control can only be reached if there is a high probability of detecting a bias in the operation of the WTP. At the same time, from an economical perspective, the data should be obtained with minimal measuring efforts and costs. Understanding the requirements with respect to online monitoring and data reliability is a first step towards direct control of the drinking water production based on the incoming water quality. Therefore, in this paper a design methodology is described which helps to develop a water quality monitoring scheme. This will be explained by means of a case study for the WTP Weesperkarspel in the Netherlands.
2.1 Design methodology
Van Schagen et al. (2010) developed a methodology for the design of a control system for drinking water treatment plants. This methodology was based on experiences with control design procedures for chemical plants and was modified to fit the main objectives of a drinking water treatment plant. In the same vein, the same methodology was used for the design of an optimized water quality monitoring scheme. The methodology takes into consideration the (1) objectives, (2) operational constraints and (3) disturbances. These first three steps determine the required water quality parameters. The subsequent steps help to determine the conditions the water quality information should comply with, including the following:
-
determining treatment step objectives,
-
determining operational control options,
-
determining water quality parameters taking into consideration both process and control aspects,
-
identifying process characteristics,
-
evaluating available (indirect) measurements,
-
determining an individual monitoring strategy per treatment step, and
-
determining an integrated monitoring strategy of treatment plant.
2.1.1 Treatment step objectives
The treatment step objectives depend on the feed water quality and the type of treatment step considered. The overall objective of a drinking water treatment plant is the production of safe drinking water fulfilling the quality standards defined by national and international guidelines. The main objective of a treatment step for an existing plant should be the focus on water quality and less on the chemical or energy consumption (van der Helm et al., 2008b). Therefore it should be evaluated which parameters present in the feed water quality can be influenced per treatment step. In order to do so, process knowledge of the different treatment steps is indispensable (Poch et al., 2004). Van Schagen (2009) indicated that mathematical models are a powerful tool to evaluate the sensitivity to process objectives and disturbances and help find the appropriate controlled variables.
2.1.2 Operational control options
Depending on the design of the treatment step, certain operational control options are available to make changes to the treatment process. Examples of operational control options are the change in chemical dosage, flow division and backwash, and regeneration frequency. The primary focus is on the operational changes that can be performed within the existing plant layout.
2.1.3 Required water quality parameters
Based on the treatment step objectives and existing operational control options, the water quality parameters that are influenced by the treatment step are determined. Ideally these water quality parameters should be monitored. Besides the water quality parameters that are influenced by a treatment step, there are water quality parameters that influence the efficiency of a treatment step. For example, the water temperature has an effect on the ozone decay rate. The decay rate increases with increasing temperatures (Elovitz et al., 2000). This may result in a higher required ozone dose in summertime, taking into consideration that the disinfection requirements are also different with different temperatures.
2.1.4 Process characteristics
The required monitoring frequency and sensitivity of the selected water quality parameters may also vary depending on the process characteristics. The process characteristics describe the time interval during which changes occur and the order of magnitude in which changes occur. For instance, the contact time in an ozone reactor can vary from a couple of minutes to 1 h, depending on the dimensions, while the time between two regeneration cycles of activated carbon typically is expressed in years. These different reaction times require different measurement frequencies. The order of magnitude relates to the required accuracy of the measurement. For example, ozone typically degrades quickly in water due to the reaction with organic compounds in the water. This determines that the required measurement frequency should be high.
2.1.5 Evaluate available measurements for the identified water quality parameters
Based on the evaluation of the required water quality parameters and existing process characteristics, the available (online) measurements should be evaluated. A wide range of methodologies exist for determining water quality parameters, from certified laboratory measurements to online measurements. Depending on the variability of the process, the turnaround time of laboratory measurements is not always fast enough. To come to an optimal water quality monitoring scheme, online water quality sensors also should be considered. In this study the following evaluation criteria for the available online sensors were assessed:
-
easiness: is the sensor easy to use, and is the measuring principle easy to understand?
-
sensitivity: is the method sensitive enough?
-
maintenance: does the sensor require much maintenance?
Costs for laboratory measurements as well as the purchasing and maintenance costs for online sensors were indicated. Besides online sensors developed to measure one specific parameter, available surrogate sensors, used to estimate a water quality parameter value, and soft sensors were assessed.
2.1.6 Determine individual monitoring strategy per treatment step
The individual monitoring strategy defines which water quality parameters per treatment step should be monitored, with a selected frequency and location. The evaluation of available measurements for the identified water quality parameters forms the basis for the monitoring strategy, subsequently ranked by the most critical parameters in the treatment plant. Criticality is determined by two factors, (1) parameters of which the measured concentrations are close to the limit that should not be exceeded and (2) parameters that can be potentially harmful to human health.
2.1.7 Determine integrated monitoring strategy of a treatment plant
The integrated monitoring strategy defines which water quality parameters are monitored, taking into consideration the interaction between the different individual treatment processes. The evaluation of available measurements for the identified water quality parameters forms the basis for the monitoring strategy, again ranked by the most critical parameters in the treatment plant. The monitoring strategy can be embedded into the process control strategy to ensure optimized control based on the most critical parameters.
Table 1Summary of water quality parameters required to monitor ozonation and associated available online sensors.
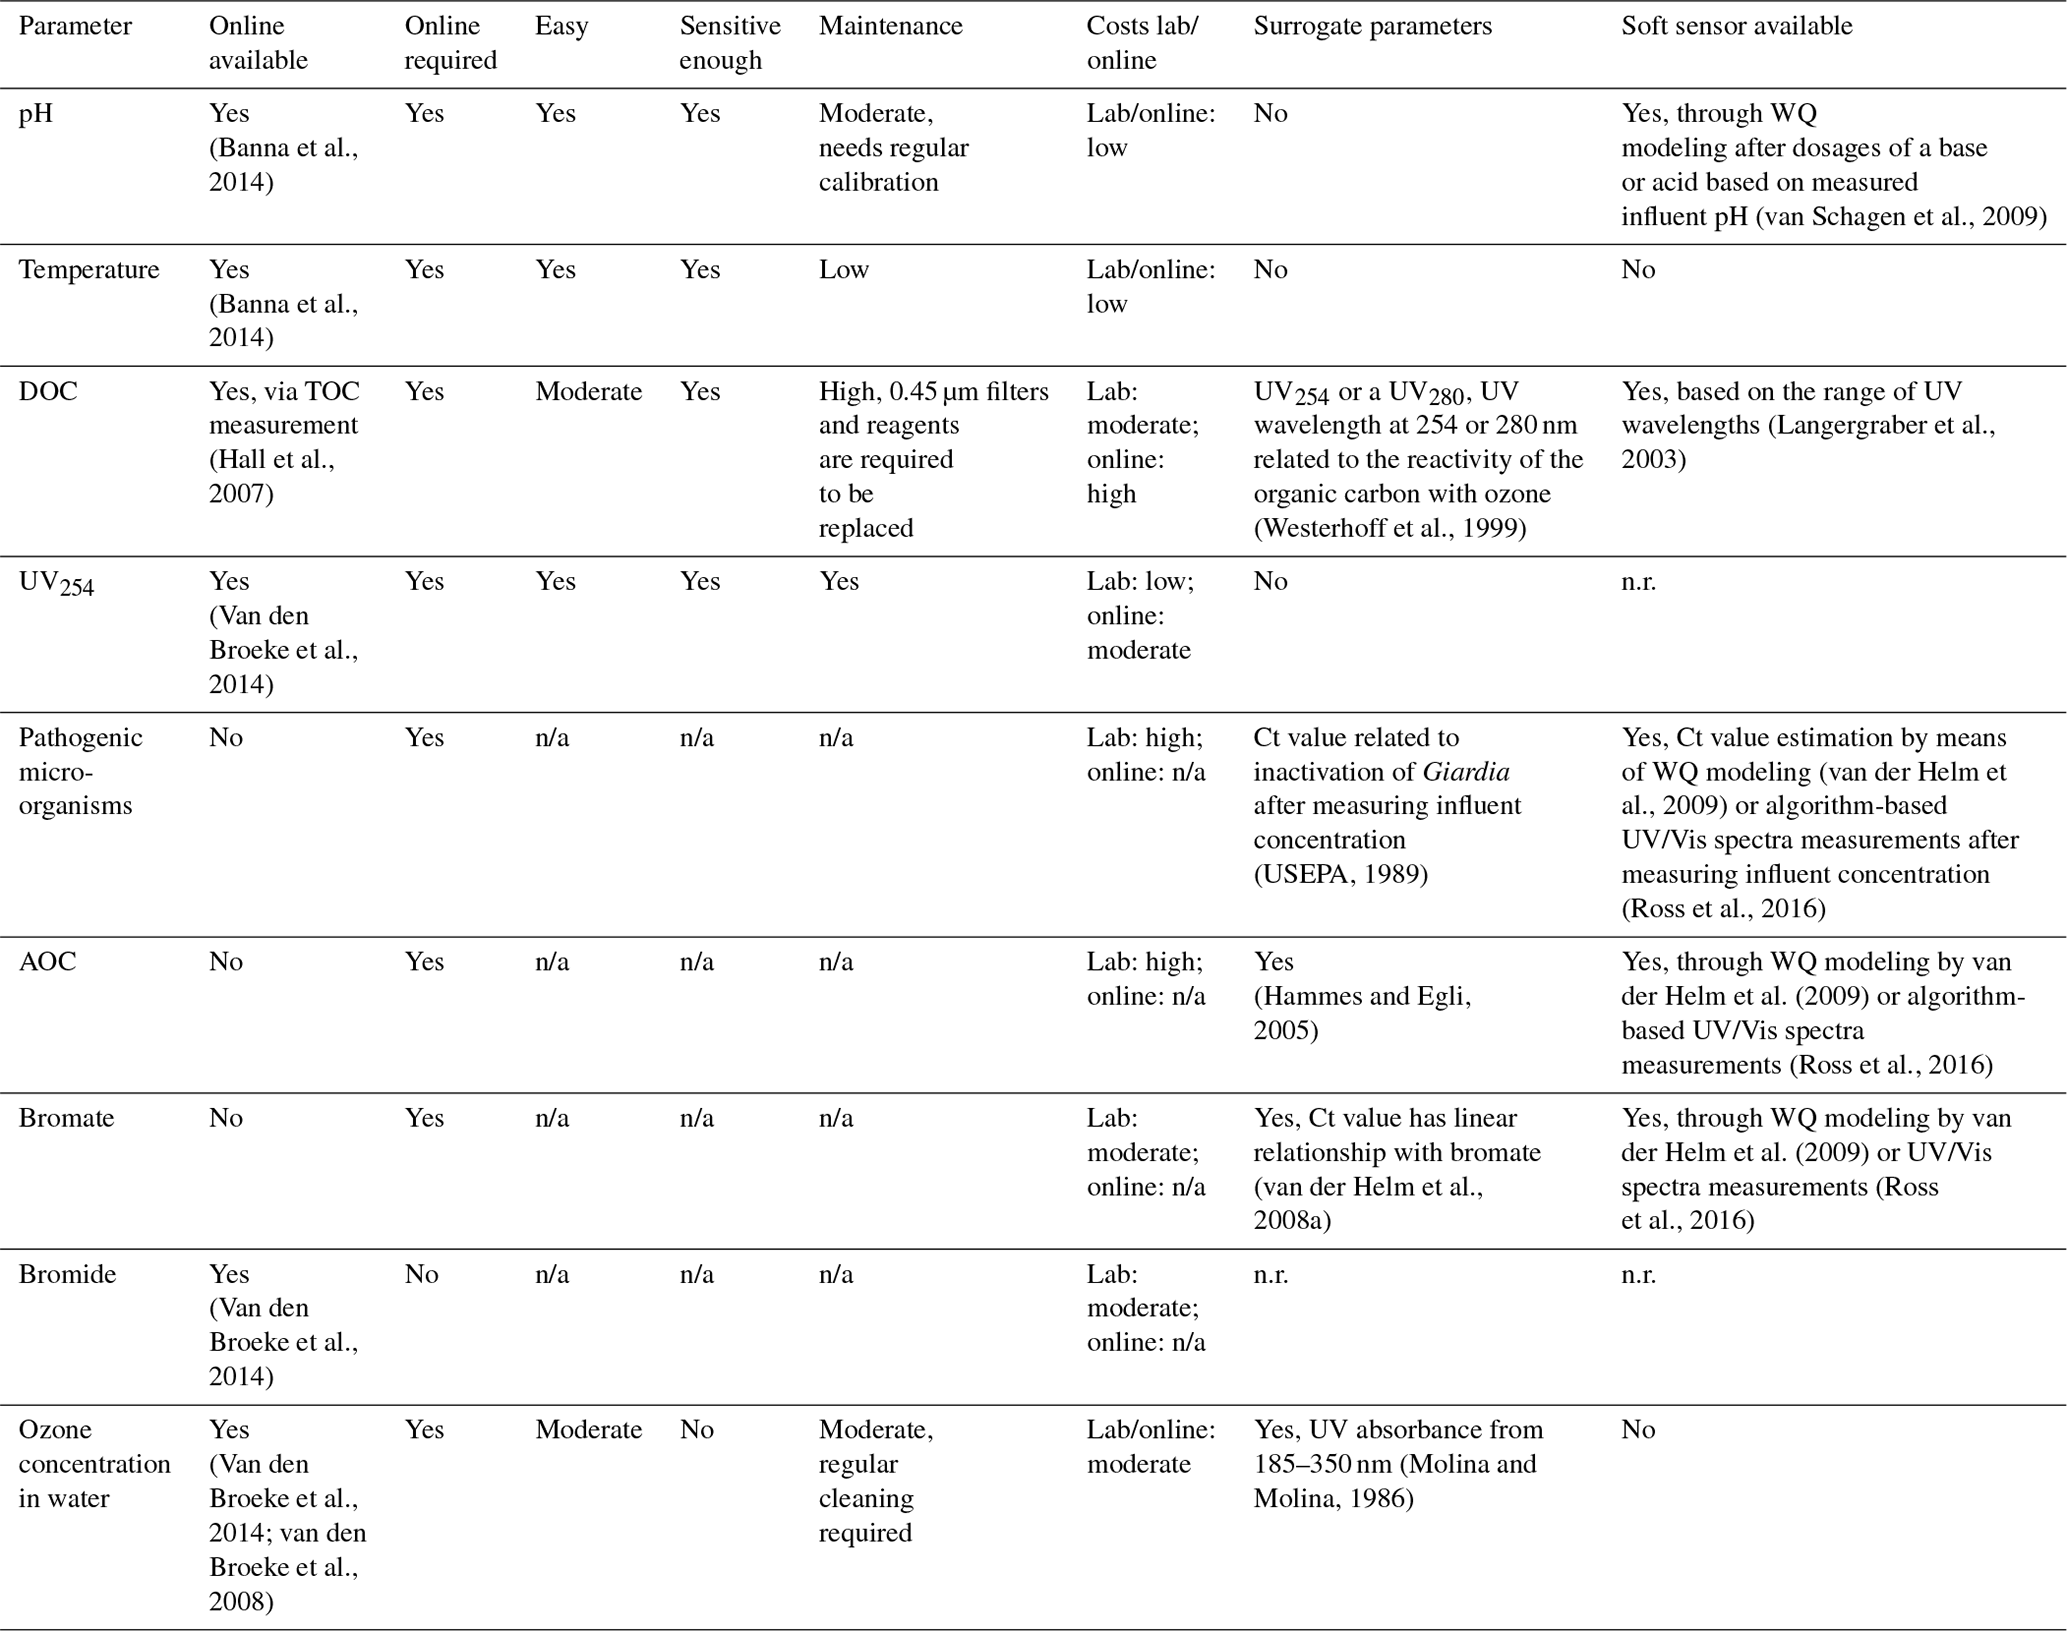
Note that n/a stands for not applicable and n.r. stands for not required.
2.2 Case study: ozonation and biological activated carbon filtration at Waternet
At the Weesperkarspel production location of Waternet, the water cycle company of Amsterdam and its surroundings, ozonation, pellet softening, biological activated carbon (BAC) filtration and slow sand filtration are the main steps in the production of safe drinking water. The feed water is humics' rich seepage water from the Bethune polder, sometimes mixed with the Amsterdam–Rhine canal, which is pre-treated by coagulation, sedimentation and retention of approximately 100 d in a lake reservoir, followed by rapid sand filtration. It is then transported to the Weesperkarspel treatment plant. At Weesperkarspel, the production of drinking water is roughly divided into two parallel lanes (the north and south lane), each consisting of several individual reactors or filters per treatment step. In each lane the water is mixed after each treatment step. The control actions can be modified at the individual level; however, for the purpose of this paper, it has been chosen to focus on the mixed influent and effluent of one lane only and not on the individual reactor or filter level. The treatment processes ozonation and BAC filtration have been evaluated. These processes are frequently applied at surface WTPs and are susceptible to changes in the feed water quality. Besides this, these processes have several control options, and an interaction between the two processes exists.
Previously, the following online measurements were installed to monitor the ozonation and BAC filtration process (Fig. 1).
pH and turbidity were monitored at the influent of the ozonation step. The temperature was monitored in the influent of the BAC filtration. After BAC filtration dissolved oxygen (DO) and pH were measured, and the pressure drop was recorded over each of the individual BAC filters.
The results of the evaluation of each step to come to an optimized water quality monitoring scheme are described below, followed by a discussion on the outcomes of the assessment versus the previous and current monitoring strategy. Research carried out at the pilot plant of Weesperkarspel was used to obtain a full understanding of the processes taking place and to enable the determination of the objectives and required water quality parameters.
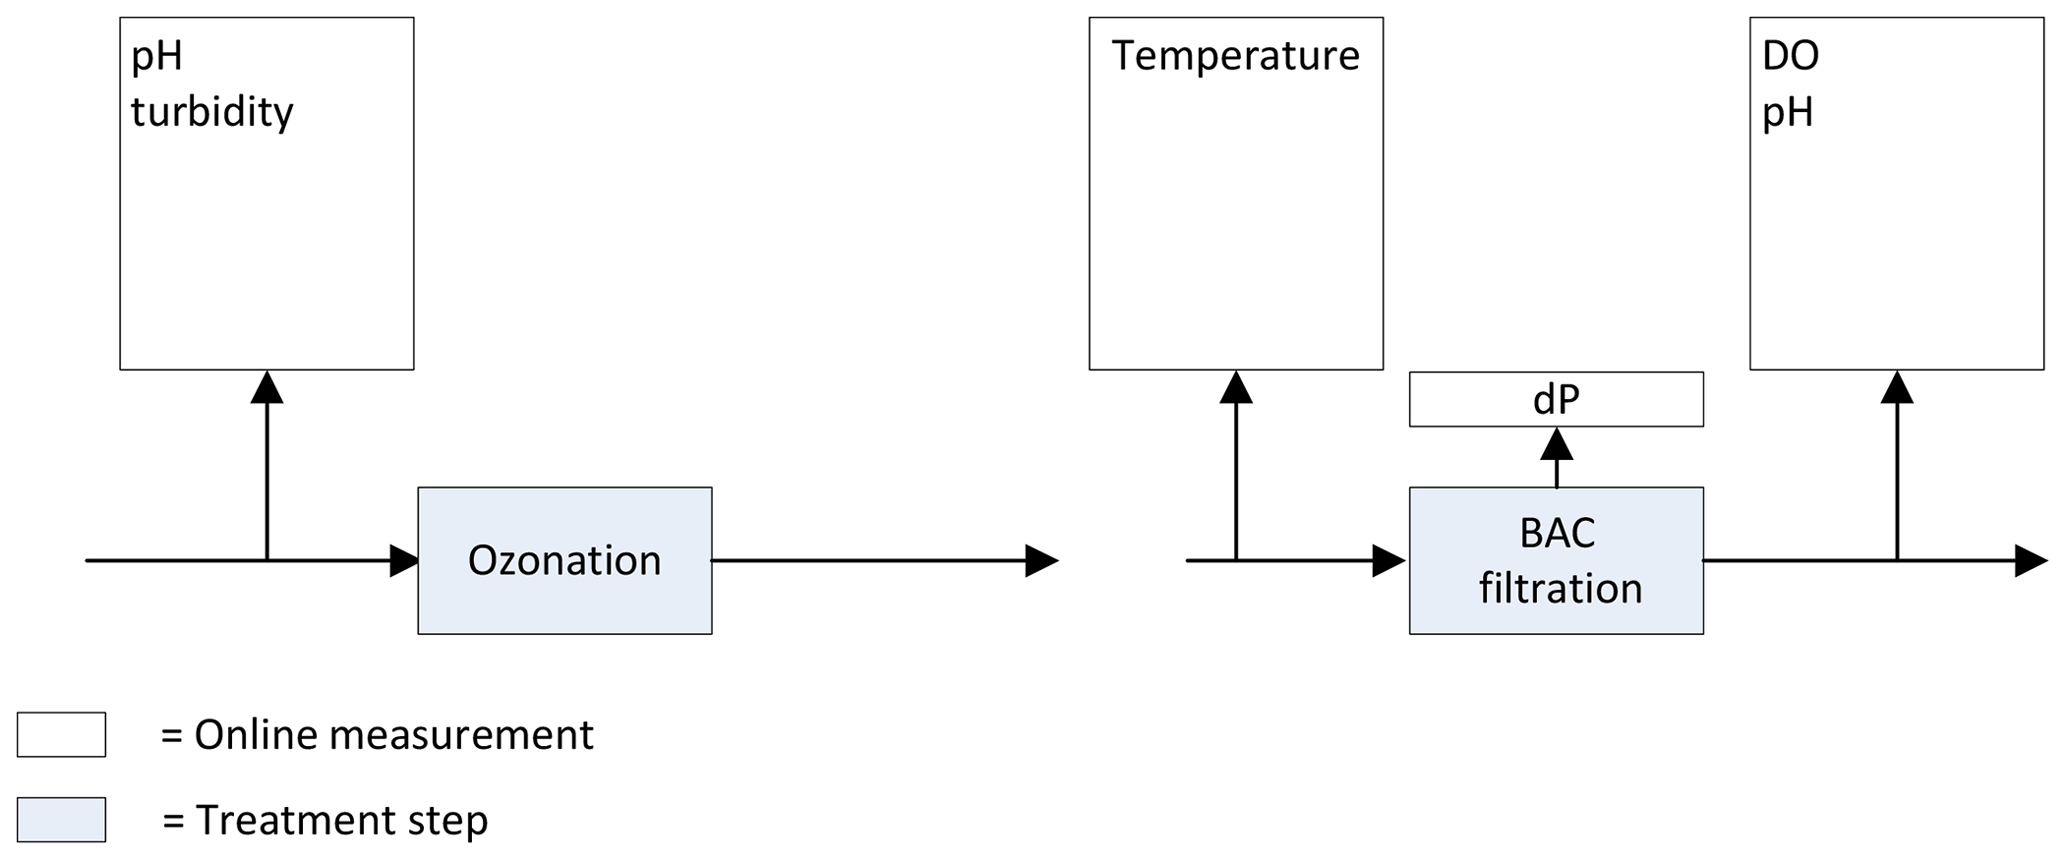
Figure 1Previously installed online measurements ozonation and BAC filtration at the Weesperkarspel treatment plant.
3.1 Treatment step objectives
In general the primary objective of ozonation is disinfection (von Gunten, 2003b). Besides this, ozonation is frequently used for the oxidation of organic micropollutants, taste, odor- and color-producing products, and natural organic matter (NOM), transforming compounds of higher molecular weight into compounds of lower molecular weight. For the ozonation step at Weesperkarspel, the specific objectives are the disinfection and oxidation of NOM (van der Helm, 2007).
The general objective of activated carbon is the removal of organic micropollutants, removal of precursors of disinfection by-products, and the removal of organic compounds causing color, taste and odor issues (van der Aa et al., 2011). When activated carbon is preceded by a pre-oxidation step, the biological activity in the water and on the activated carbon is enhanced, resulting in BAC filtration. At the same time, ozonation increases the polarity, resulting in a decrease in adsorption affinity (Sontheimer et al., 1988). As a result of the pre-oxidation step, NOM is removed through both biodegradation and adsorption. At Weesperkarspel the purpose of BAC filtration is the removal of organic matter to prevent biological growth in the distribution system and to remove toxicity and taste- and odor-causing compounds (Graveland, 1996). Besides this, the BAC filters remove the carryover from the preceding pellet softening step.
Table 2Summary of water quality parameters required to monitor BAC filtration and associated available online sensors.
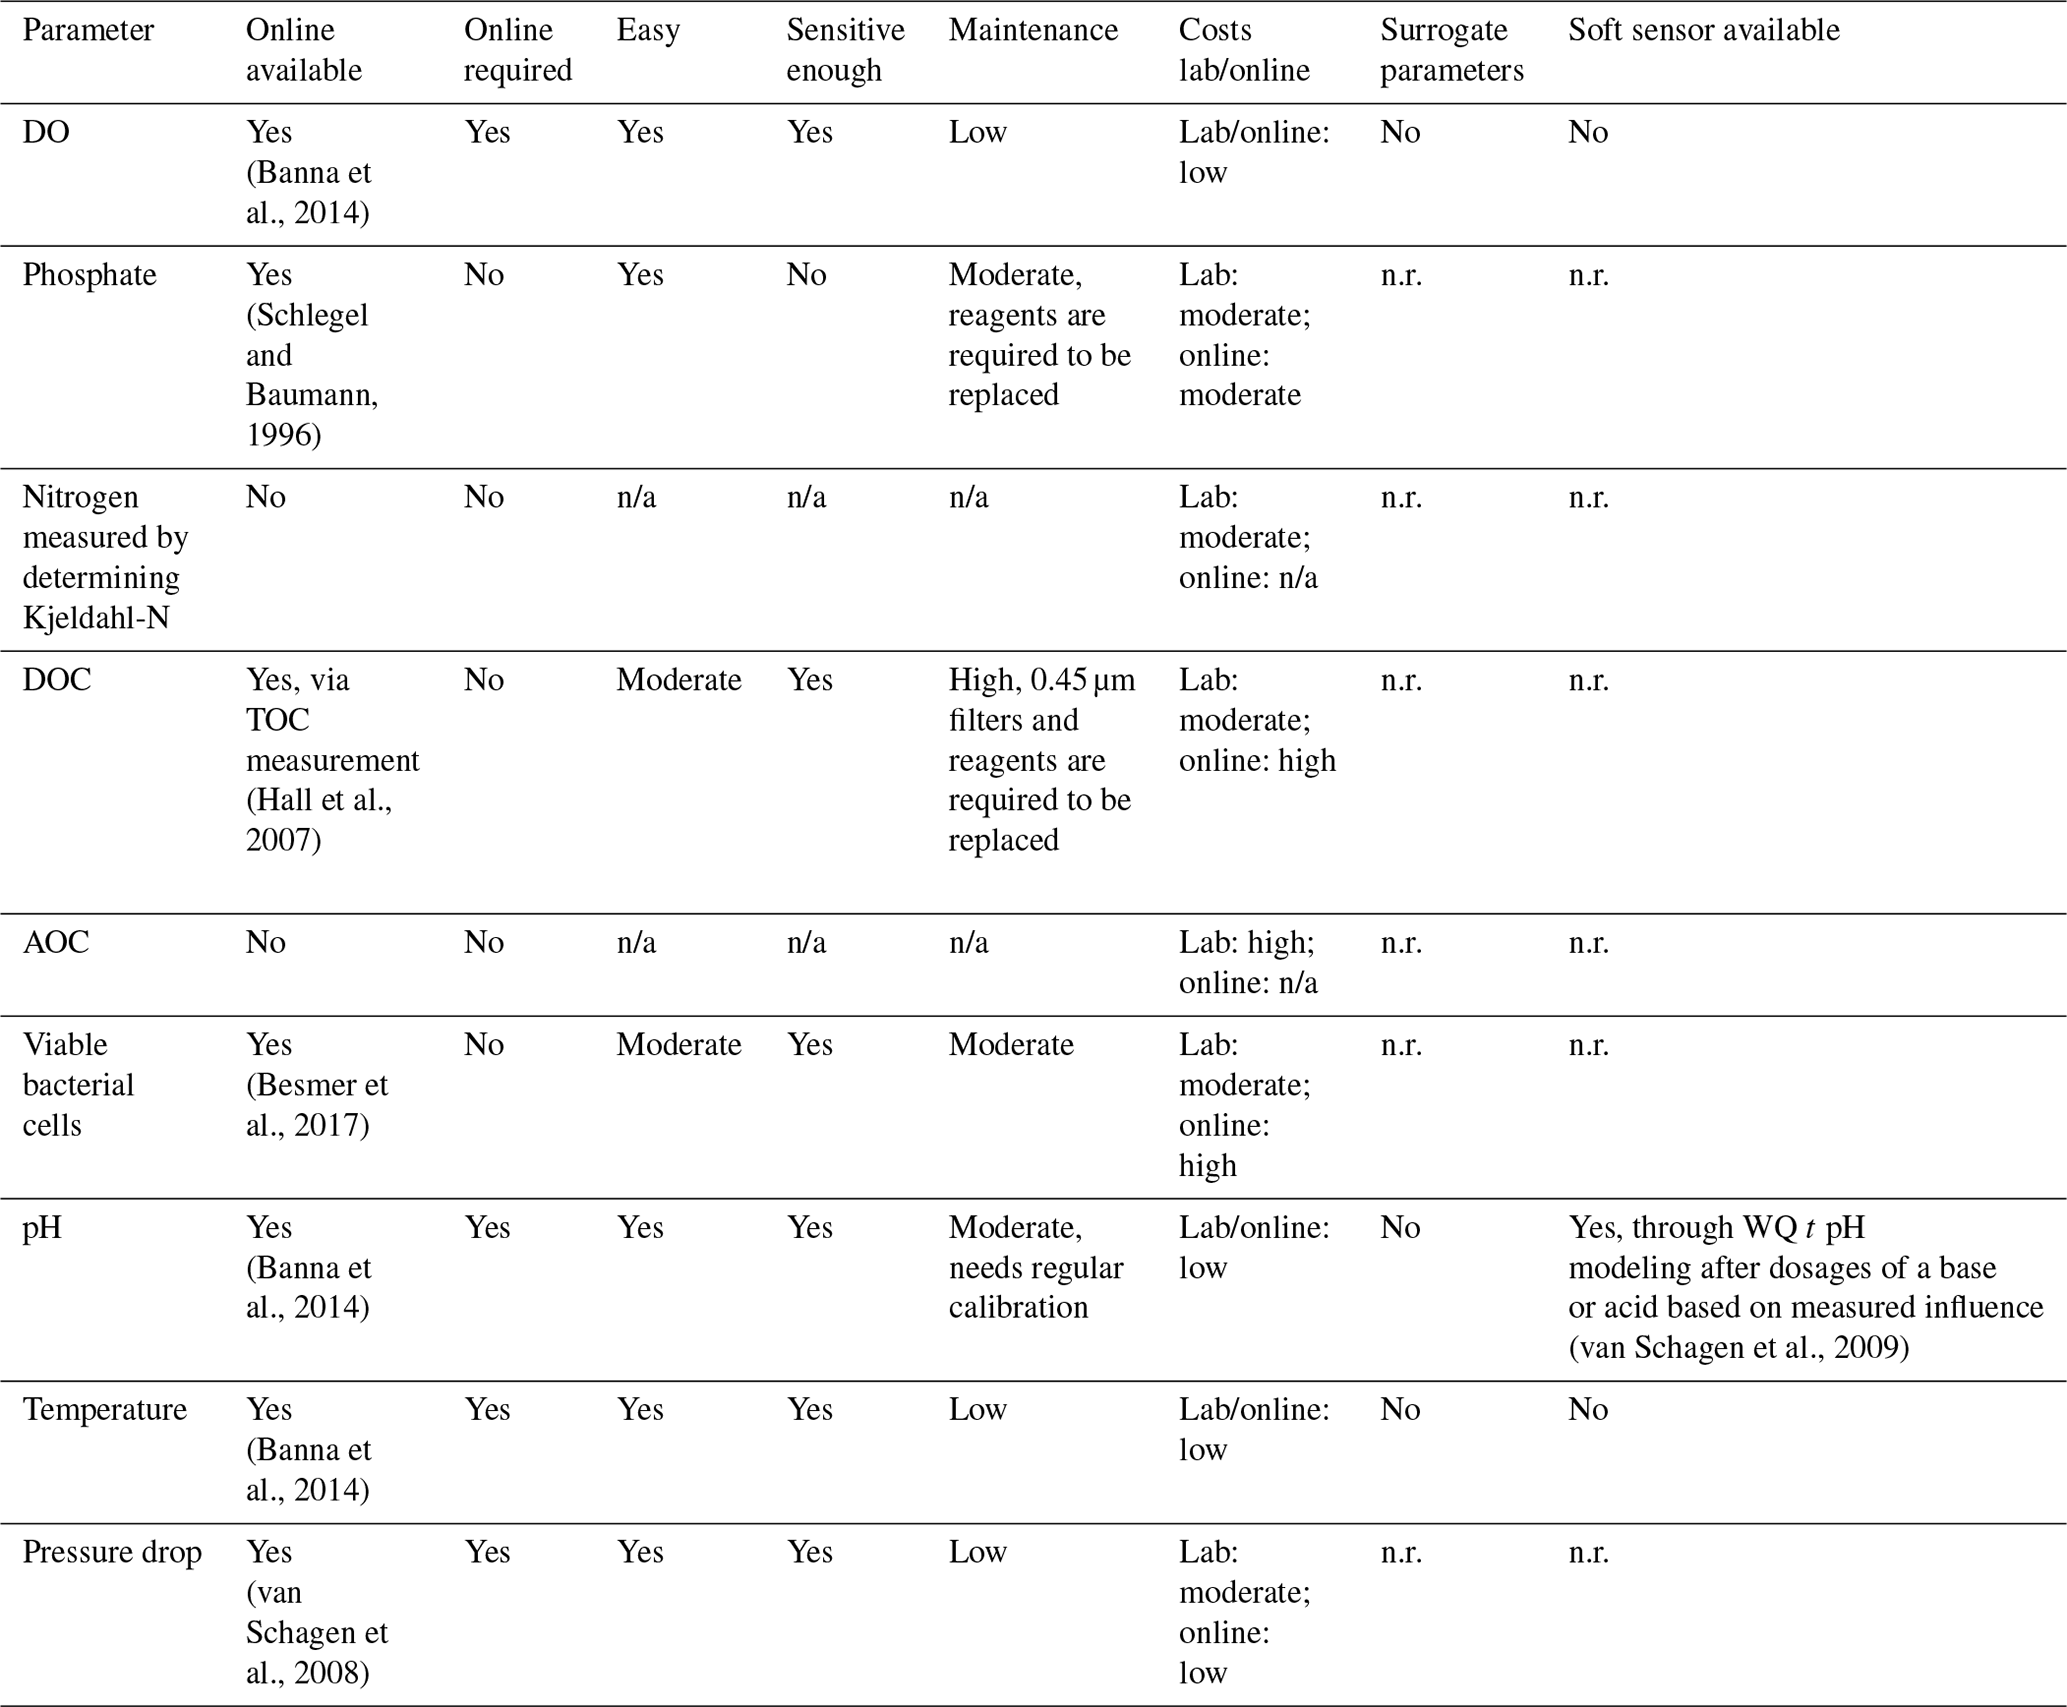
Note that n/a stands for not applicable and n.r. stands for not required.
3.2 Operational control options
The production flow is controlled by the demand for drinking water. The buffering capacity in the treatment plant is the clean water storage reservoirs situated before the water is distributed to the customers (van Schagen et al., 2010). To ensure sufficient reliability, the treatment plant is set up in a redundant way with multiple lanes operated in parallel. It is possible to change the flow division over the different production lanes; however this is only done when one of the lanes has less treatment capacity or is out of production due to e.g., maintenance. Due to the buffering capacity of the clean water storage reservoirs, the treatment plant is already operated at a constant optimized flow; therefore, in this case, production flow was not considered as a control action.
The only remaining control action for ozonation is the ozone dosage. The ozone dosage is obtained by a combination of ozone in gas concentration and the gas flow. Both parameters can be adjusted to obtain the desired ozone dosage.
For BAC filtration the control actions within the existing treatment setup are the backwash frequency, currently operated at an interval of every couple of days to once a month per filter and backwash program. Currently a combination of air and water is used. The activated carbon is regenerated between every 1 and 3 years. Carbon dioxide is dosed before the BAC filters to correct for any high pH resulting from the caustic soda dosage in the pellet softeners. The dosing of carbon dioxide is actively controlled based on the measured pH, which is related to the functioning of the pellet softeners and therefore not included in the overview provided in Fig. 1. A high pH could negatively affect the biodegradation efficiency (Seredyńska-Sobecka et al., 2006) and promotes the precipitation of calcium carbonate on the activated carbon grains. Oxygen and caustic soda can be dosed in the effluent of the BAC filters to correct low pH and oxygen concentrations as a result of the biological activity in the filters.
3.3 Required water quality parameters
As indicated previously, ozone is an unstable oxidant in water. Ozone decomposition in water consists of a fast initial phase (in the range of seconds) and second phase (in the range of minutes) during which ozone concentration decreases via first order kinetics and disinfection of the more resistant pathogenic microorganisms takes place (von Gunten, 2003a; van der Helm et al., 2008a). A commonly used method to determine the disinfection capacity of ozonation is by calculating the exposure of pathogens to ozone, expressed as the Ct value, a product of the (residual) concentration of the disinfectant (C), in this case, ozone and contact time (t) (WHO, 2008).
Water quality parameters that influence the efficiency of the ozonation step are temperature, pH, and, relevant for Weesperkarspel, scavengers such as NOM concentration and character (von Gunten, 2003a). A measurement commonly used to indicate the NOM concentration is the dissolved organic carbon (DOC) concentration. The DOC concentration is determined by filtering the sample over a 0.45 µm filter and measuring the total organic carbon (TOC) concentration. In order to assess the character of NOM, the specific UV absorbance (SUVA) can be calculated by dividing the UV absorbance measured at a wavelength of 254 nm (UV254) by the DOC concentration (van der Helm et al., 2008b; Edzwald and Tobiason, 1999). Another method is to use fluorescence excitation emission matrices to characterize NOM (Baghoth et al., 2011; Sgroi et al., 2018). These water quality parameters play a role in the ozone dosage required to achieve the desired disinfection and should therefore be monitored. For Weesperkarspel it was determined that the disinfection of Giardia, Cryptosporidium and Campylobacter is sufficient to determine the microbiological safety of the water (van der Helm et al., 2008b). To be able to monitor the efficiency of the ozonation step, at least one of the following parameters should be measured:
-
pathogenic microorganisms such as Cryptosporidium, Giardia and Campylobacter or
-
the ozone concentration at different contact times to be able to determine the Ct value (van der Helm et al., 2009).
During ozonation, disinfection by-products are formed. The oxidation of NOM promotes the presence of AOC concentration in water (van der Kooij et al., 1989). AOC promotes the regrowth of bacteria in a distribution system, amongst other things, and, therefore, it should be sufficiently removed in the subsequent treatment steps. Water without residual chlorine is considered to be biologically stable if the AOC concentration is below 10 µg acetate-C L−1, whereas water with residual chlorine is defined as biologically stable for AOC concentrations below 50 µg acetate-C L−1 (van der Kooij, 1992; Escobar et al., 2001). Besides AOC, bromate is formed if bromide is present in the feed water. Bromate is probably carcinogenic to humans (USEPA, 2018).
During BAC filtration, biodegradation takes place by microorganisms present on the external surface and in the macro-pores of the BAC filter grains, which biodegrade NOM in the water (Servais et al., 1994). The activity of the microorganisms (biomass) determines the degradation rate of NOM (Lazarova and Manem, 1995). The activity and concentration of the biomass depends on the concentration of nutrients (carbon, phosphate and nitrogen), the dissolved oxygen concentration, temperature, pH and residual disinfectant in the feed water (Simpson, 2008). Uhl and Gimbel (2000) described that for the biological removal of ammonia, the deposit of bacterial cells from the influent was necessary to maintain a solid biofilm. However for Weesperkarspel it was shown that the feed in bacterial cells to the BAC filters was not necessary to obtain a sufficient biodegradation efficiency (Ross et al., 2019); hence no online measurement of bacterial cells is required. Besides biodegradation taking place, the adsorption of NOM and toxic, color, taste and odor compounds takes place. In addition, at Weesperkarspel, BAC filtration is simultaneously applied for the removal of suspended solids and carryover. Due to clogging of the filter bed by suspended solids, carryover and in some cases biomass, the filters need to be backwashed frequently. The pressure drop over the filters and turbidity in the effluent indicates the state the filter is in and whether it needs to be backwashed. In case of Weesperkarspel, the pressure drop is the determining parameter.
3.4 Process characteristics
Ozone is dosed to the water; after this a reaction takes place in the range of seconds to minutes. A change in the ozone dose or change in feed water quality can have an immediate effect on the effluent quality. In the past, the dosing strategy was determined by the water temperature, with two different set points, below 12 and above 12 ∘C. Van der Helm et al. (2009) suggested that this negatively influenced the disinfection during ozonation. However, more detailed research by Wiersema (2018) could not confirm this. Since ozonation is one of the main processes that can achieve disinfection, high frequency monitoring is required, enabling direct control of the ozonation step.
In contrast to ozonation, BAC filtration is not a dosing process, but it is instead a separation and degradation process by means of filtration, adsorption and biodegradation. The different processes all have their associated time intervals. The shortest time interval is the clogging of the filters; depending on the location in the treatment train, backwashing needs to be carried out between every couple of days and once a month. Backwashing occurs based on a pressure drop over the filter or after a maximum period of time. The pressure drop should be monitored on a regular basis.
As indicated in the required water quality parameters section, the activity of the biomass present on the carbon grains determines the biodegradation efficiency. Ross et al. (2019) showed that a change in feed water quality does not necessarily result in a change in effluent quality; hence there is no direct need for the close monitoring of the filters. In case the feed water quality changes for a longer period of time, the biomass will adopt itself to the new situation, which can take up to 2–3 months (Servais et al., 1994).
Depending on the NOM loading, the activated carbon starts showing a breakthrough of organic micropollutants and pesticides after a run time of 6–9 months if no biodegradation takes place, while if biodegradation takes place this can last up to 2–5 years before the activated carbon needs to be regenerated (Simpson, 2008). Although BAC filters have proven their ability to intercept sudden changes in water quality, the DO can be used as an indicator for the biological activity in the filter and for identifying any disruptions taking place (van Schagen, 2009).
3.5 Evaluation of available measurements for the identified water quality parameters
A summary of the required water quality parameters, as determined in the paragraphs describing the water quality parameters, can be found in the first columns of Table 1 (ozonation) and Table 2 (BAC filtration). In the second column it is indicated per parameter if an online measurement, able to measure at the limit of detection required, is available. Depending on the monitoring frequency required, as described in the process characteristic paragraphs, it was determined if a parameter should be available online. If the monitoring frequency should be daily or more, it was indicated with a yes in the third column. To gain a better understanding of the applicability of the online sensors, the ease of use, sensitivity and maintenance requirements were evaluated in columns four through six. The costs related to a measurement in the lab and installation of an online sensor are listed in column seven.
Evaluation of the available online sensors and their characteristics was based on literature research, indicated by the references included per parameter. Besides online sensors that measure one specific parameter, available related surrogate parameters (column eight) and soft sensors (column nine) were also captured. It should be noted that for some surrogate parameters and soft sensors a start concentration is required first before the concentration of the requested parameter can be estimated.
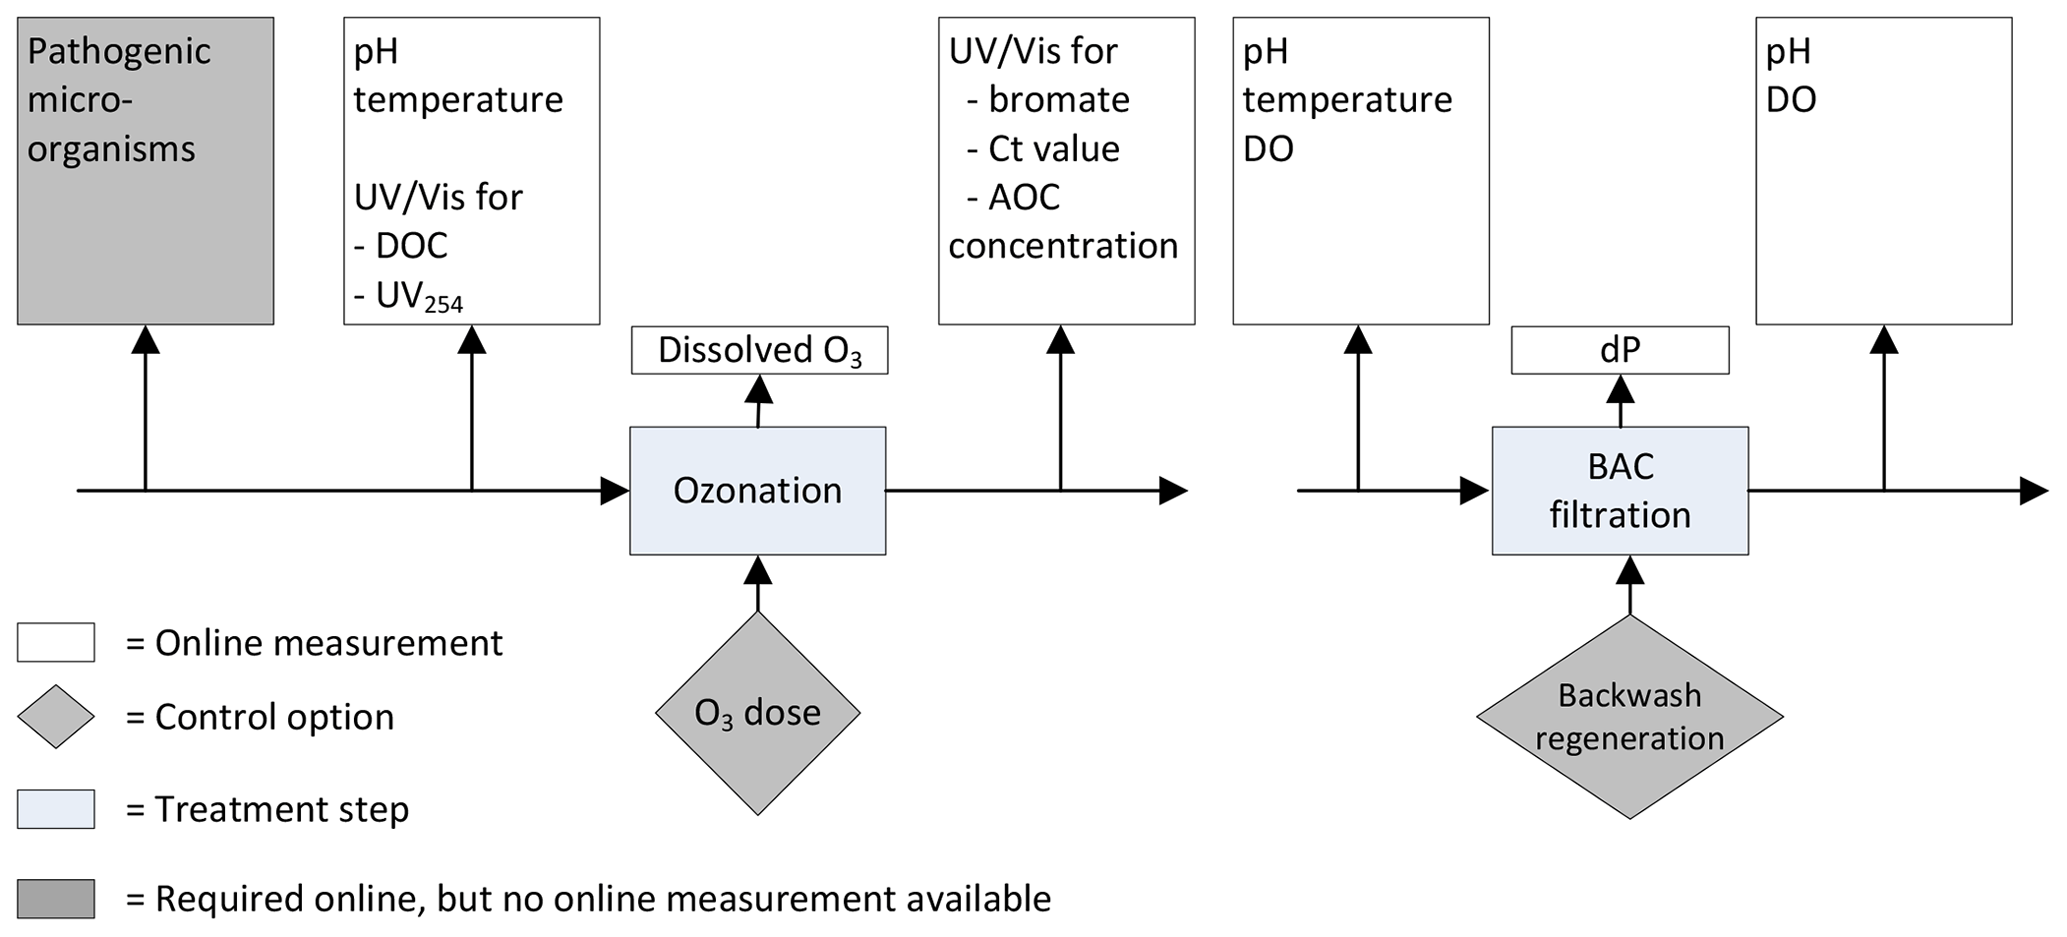
Figure 2Required online water quality information for optimized monitoring and control of ozonation and BAC filtration.
3.6 Determination of an individual monitoring strategy per treatment step
Figure 2 shows the individual monitoring strategy per treatment step determined by the water quality assessment captured in Table 1 for ozonation and Table 2 for BAC filtration. The results are described in detail below.
3.6.1 pH, temperature and DO
There are sufficient online sensors available to measure the pH, temperature and DO. These sensors are relatively easy to use and sensitive enough. The pH sensor requires frequent maintenance. The costs of measurement, either online or in the laboratory, are low. The efficiency of ozone is, amongst other things, determined by the pH and temperature and should therefore be monitored continuously. The DO and pH are a continuously controlled effluent parameter in BAC filtration. The pressure drop indicates if a filter needs to be backwashed. The DO and pH are an indicator for the biological activity in the filter and capable of identifying any disruptions taking place (van Schagen, 2009).
3.6.2 DOC and UV254
The NOM concentration, measured through DOC, is a scavenger and directly interferes with disinfection, requiring it to be monitored in the influent of the ozone step. The ozone dosages used hardly affect the DOC concentration, limiting the need for monitoring downstream of the ozone step (van der Helm et al., 2008a). For TOC there is an online sensor available which measures sensitively enough. By the inclusion of a 0.45 µm filtration step, the DOC is determined. It does require frequent maintenance for replacing the 0.45 µm filters and reagents. The online sensors are still expensive, whilst the lab measurements are low-cost and around EUR 20 per sample. Alternatively, a UV absorbance sensor measuring the UV absorbance at wavelength of 254 or 280 nm can be used as a generic sensor providing insights in the reactivity of ozone with the organic matter (Westerhoff et al., 1999). Besides direct measurement or a generic sensor, Langergraber et al. (2003) developed a soft sensor allowing for the estimation the DOC concentration based on measured UV/VIS wavelengths and by applying principal component analysis followed by partial least squares regression. These soft sensors are required to be calibrated locally based on an obtained dataset from lab measurements. The UV/Vis sensor is, besides regular cleaning, easy to maintain and less than half the price of a specific TOC sensor. Besides DOC, UV254 also determines the efficiency of ozone and should therefore be monitored continuously. A specific online sensor is available which only measures UV254, is easy to use, sensitive, and low in maintenance and costs. An alternative generic sensor is the UV/Vis sensor which measures all wavelengths between 200 and 735 nm. This should only be used instead if the sensor is used to measure other parameters, such as DOC, as well.
3.6.3 AOC, bromate and bromide
AOC and bromate are disinfection by-products formed during ozonation. Depending on the influent concentrations of DOC and bromide and the amount of ozone dosed, the AOC and bromate concentration are determined. There is no online sensor available for measuring the AOC concentration in accordance with the approved standard methods (Eaton et al., 2005). AOC is one of the disinfection by-products that needs to be monitored. A change in organic matter composition and/or ozone dose will directly result in a change in AOC concentration, therefore requiring online monitoring in the effluent of the ozone step. AOC is subsequently biodegraded in the BAC filtration step and enhances the microbiological activity in the filters. Ross et al. (2019) showed that a sudden change in AOC concentration does not result in a direct deterioration of the effluent quality of the BAC filters. Therefore, a continuous monitoring of the AOC concentration in the effluent of the BAC filter is not required. The lab measurements are high in costs, due to the labor intensity of the analysis. Hammes and Egli (2005) developed a quicker laboratory method to determine the AOC concentration using flow cytometry. Until now this method has only been available as an offline method and is therefore not suitable for online monitoring. The water quality model developed by van der Helm et al. (2009) is able to predict the formation of disinfection by-products such as AOC by using MATLAB Simulink®. Another soft sensor is the software algorithm published by Ross et al. (2016) that uses different UV/Vis wavelengths to predict the AOC formation.
There are no online sensors available for measuring the bromate concentration. Bromate needs to be monitored for compliance since it is possibly carcinogenic and is not removed in existing downstream treatment steps. A change in bromide concentration or a change ozone dose can impact the bromate concentration directly. The bromide levels in the influent of the Weesperkarspel treatment plant have been very stable, requiring no need for continuous monitoring. Since the bromate levels can change with a changing ozone dose, online monitoring of bromate in the effluent of the ozone step is proposed. The lab measurements are moderate in costs, due to the reagents required. Van der Helm et al. (2008a) found a linear relationship between the bromate concentration and Ct value, allowing the Ct value to be a surrogate parameter once the initial bromate concentration is known. Cromphout et al. (2013) found a linear relationship between the ozone dose, temperature and bromate formation. These models can be used to predict the bromate concentration based on the ozone dosed, temperature, pH and bromide concentration in the influent. Another available soft sensor is the software algorithm published by Ross et al. (2016) using different UV/Vis wavelengths to determine the Ct value and bromate formation. It should be tested as to what extent these algorithms can be locally calibrated for changing bromide concentrations.
3.6.4 Pathogenic microorganisms and ozone concentration in water
There are no online sensors available to specifically measure a certain pathogenic microorganism. The lab measurements are high in costs, due to labor intensity of the analysis. The pathogenic microorganism concentration in the influent together with the above parameters determine the required ozone dosage and therefore require continuous monitoring. The USEPA (1989) published Ct values for determining the log inactivation of pathogenic microorganisms for different water temperatures. This allows the Ct value to be used as a surrogate parameter if the influent concentration is known. The water quality model developed by van der Helm et al. (2009) is able to predict the Ct value based on the above measured parameters and applied ozone dose. In addition, Ross et al. (2016) published a software algorithm that uses different UV/Vis wavelengths to determine the Ct value. Verification via lab analysis of pathogenic microorganisms on a weekly or monthly basis, depending on the variability of the source water quality, will help determine the log inactivation and associated Ct value to be achieved. Besides using soft sensors to determine the Ct value based on a change in the UV/Vis pattern, the ozone in water can be determined by online measurements. These measurements require local calibration by means of lab measurements. These easy and sensitive measurements require regular maintenance to prevent biofouling. The cost of online and lab measurements is moderate due to the calibration fluid required. In order to be able to determine the Ct value based on the ozone in water concentrations, multiple sampling points are required in space.
3.6.5 Phosphate and nitrogen
Phosphate, nitrogen and carbon are the nutrients required for the microbiology in the BAC filters to grown on. Phosphate is a parameter in wastewater environments that is frequently measured online and controlled. The available online measurements are easy to use and sensitive enough, but they require regular maintenance due to the reaction agents used. The costs of both lab and online application are moderate. To the authors' knowledge, there are no online nitrogen measurements available. The costs of lab measurements are moderate. In the current treatment plant setup there is no option to alter the phosphate or nitrogen concentration (by means of dosing), and as a result there is no need to continuously monitor these concentrations in the influent of the BAC filters.
3.6.6 Viable bacterial cells
Viable bacterial cells are present in the surface water. During ozonation, disinfection of viable bacterial cells typically takes place, which subsequently can regrow in the following treatment steps (Vital et al., 2012). The determination of viable bacterial cells has developed in the last couple of years from a laborious intensive measurement using microscopy to the rapid determination in the lab using flow cytometry to customizing the flow cytometry equipment for online applications (Besmer et al., 2014, 2017). Ross et al. (2019) showed that the effect of viable bacterial cells in the influent of the BAC filters is limited in respect to the performance of the BAC filters, therefore discarding the need for online monitoring. The costs of both lab and online measurements are still high but expected to reduce in the future as per the innovation taking place to enhance rapid detection.

Figure 3Current online water quality monitoring of ozonation and BAC filtration at the Weesperkarspel treatment plant.
3.6.7 Pressure drop
The pressure drop is typically measured to determine the clogging ratio in the filter bed. Pressure drop measurements are available online and have been fully developed. It is an easy measurement, which is sensitive and low in maintenance. The costs are low. For BAC filtration it is, besides turbidity, the main indicator if a filter is clogging and needs backwashing. Online monitoring is therefore required and frequently applied.
3.7 Determination of an integrated monitoring strategy of a treatment plant
When evaluating the ozonation and BAC filtration step as an integrated system, it is not required to monitor AOC in the effluent of the ozonation due to the robustness of the BAC filtration step (Ross et al., 2019). The DO concentration in the influent of the BAC filter will always be sufficient as a result of the preceding ozonation step; therefore there is no need to continuously monitor this concentration in the influent. For Weesperkarspel, the temperature of the water and pH will not change due to the application of ozonation; hence there is no need to monitor this in the influent of the BAC filters.
In Fig. 3 the current monitoring strategy of Weesperkarspel is shown. This strategy was adjusted per the outcomes of the different research described in this paper (van der Helm, 2007; Ross et al., 2016; van Schagen, 2009).
When comparing the sensors installed in Fig. 3 with Fig. 2, considering the sensors that can be skipped based on the integrated approach, only four differences are observed. In the influent of the ozone step, only UV254 is measured instead of UV254, and DOC and the turbidity are measured. In the effluent of the ozone step the i::scan™ is installed measuring at a wavelength of 254 nm, instead of the i::scan™ that is able to measure the full spectrum allowing for the estimation of bromate and the Ct value. However, the Ct value can also be calculated by the installed ozone measurements, and the UV254 can give a good indication of the achieved Ct as well (Westerhoff et al., 1999). No differences are observed for the BAC filtration step when considering the integrated approach.
4.1 Advances in online water quality monitoring
Evaluation of available online sensors showed that there are sufficient online sensors available to measure the pH, temperature and DO (Adu-Manu et al., 2017). Furthermore a lot of developments have taken place around sensors and monitors (Van den Broeke et al., 2014). Direct measurements of the more complex parameters such as AOC and bromate are not available online. When looking at the required online information for integrated control of ozonation and BAC filtration, bromate should be monitored continuously. In this case the use of soft sensors able to estimate the bromate and AOC formation help to gain continuous online data. Besides using soft sensors as surrogate sensors for parameters currently not available online, they can also provide a cost-effective alternative when used to determine multiple parameters required through one single instrument. Examples in this case were the use of UV/Vis sensors for the determination of the UV254 concentration in the influent, the estimation of DOC in influent and effluent, the formation of bromate and AOC during ozonation, and the estimation of the Ct value in the effluent of the ozonation step through one measurement.
4.2 Reliability of the data
Online identification of disturbances is only possible if the identified water quality data are accurate and continuous (van Schagen et al., 2010). Furthermore the confidence the operators have in the data is crucial, especially when soft sensors are applied instead of direct measurement (Ikonen et al., 2017). If possible, measurement via two different methods can be applied for a period of time to gain confidence by the operators to rely on soft sensors to provide the correct information. In this case the Ct value can be obtained via ozone in the water measurement multiplied by contact time or estimated via the change in the UV/Vis measurement. It should be recognized that the use of online sensors does require knowledge of the use of the sensors and (frequent) maintenance to ensure the reliability of the data.
4.3 Online water quality monitoring strategy
When comparing the previous online information (Fig. 1) with the current online sensors placed at Weesperkarspel (Fig. 3), it can be seen that in the current situation more online information is available. The expansion of the number of online sensors was driven by a better understanding of the processes taking place based on the research performed and the desire to measure these processes. During the installation and test phase, continuous attention was required to identify any deviations or maintenance requirements at an early stage. Currently the installed sensors act as an early warning system to flag any deviations in water quality and operation. The next step would be the direct control based on water quality.
The main objective of this paper was to develop a design methodology supporting the development of a water quality monitoring strategy. A seven-step approach was defined, and each step was demonstrated for the treatment processes of ozone and BAC filtration. It was shown how the previous online water quality monitoring program of the treatment plant Weesperkarspel was adjusted based on a better understanding of the processes taking place.
The evaluation of the available online sensors showed that the parameters of temperature, pH and DO are commonly available. Direct measurements of the more complex parameters such as AOC and bromate are not available online. The use of soft sensors able to estimate the bromate and AOC formation help to gain continuous online data. Besides using soft sensors as surrogate sensors for parameters currently not available online, they can also provide a cost-effective alternative when used to determine multiple parameters required through one single instrument. Examples in this case were the use of UV/Vis sensors for the determination of the UV254 concentration in the influent, the estimation of DOC in the influent and effluent, the formation of bromate and AOC during the ozonation, and the estimation of the Ct value in the effluent of the ozonation step. The online data obtained by the (soft) sensors provide the operator with continuous information as to whether the processes are operating within the required operational window.
The research data of this work can be obtained by contacting the corresponding author.
All authors contributed to the outline and content of this paper, suggested the aspects to be included per the background of the author, and contributed to the writing of the paper.
The authors declare that they have no conflict of interest.
The data were obtained from Waternet (the water cycle company for Amsterdam and surrounding areas) in the Netherlands. The authors want to thank Alex van der Helm and René van der Aa for providing input.
This research has been supported by the European Commission's Sixth Framework Programme (grant no. 018320).
This paper was edited by Pierre Le-Clech and reviewed by Wim Audenaert and Joep van den Broeke.
Adu-Manu, K. S., Tapparello, C., Heinzelman, W., Katsriku, F. A., and Abdulai, J. D.: Water quality monitoring using wireless sensor networks: Current trends and future research directions, ACM T. Sensor Network., 13, 4:1–4:44, https://doi.org/10.1145/3005719, 2017.
Baghoth, S. A., Sharma, S. K., and Amy, G. L.: Tracking natural organic matter (NOM) in a drinking water treatment plant using fluorescence excitation-emission matrices and PARAFAC, Water Res., 45, 797–809, 2011.
Banna, M. H., Imran, S., Francisque, A., Najjaran, H., Sadiq, R., Rodriguez, M., and Hoorfar, M.: Online drinking water quality monitoring: Review on available and emerging technologies, Crit. Rev. Env. Sci. Tec., 44, 1370–1421, https://doi.org/10.1080/10643389.2013.781936, 2014.
Bertelkamp, C., Reungoat, J., Cornelissen, E. R., Singhal, N., Reynisson, J., Cabo, A. J., van der Hoek, J. P., and Verliefde, A. R. D.: Sorption and biodegradation of organic micropollutants during river bank filtration: A laboratory column study, Water Res., 52, 231–241, https://doi.org/10.1016/j.watres.2013.10.068, 2014.
Besmer, M. D., Weissbrodt, D. G., Kratochvil, B. E., Sigrist, J. A., Weyland, M. S., and Hammes, F.: The feasibility of automated online flow cytometry for in-situ monitoring of microbial dynamics in aquatic ecosystems, Front. Microbiol., 265, 1–12, https://doi.org/10.3389/fmicb.2014.00265, 2014.
Besmer, M. D., Sigrist, J. A., Props, R., Buysschaert, B., Mao, G., Boon, N., and Hammes, F.: Laboratory-scale simulation and real-time tracking of a microbial contamination event and subsequent shock-chlorination in drinking water, Front. Microbiol., 8, 1900, https://doi.org/10.3389/fmicb.2017.01900, 2017.
Bosklopper, T. G. J., Rietveld, L. C., Babuska, R., Smaal, B., and Timmer, J.: Integrated operation of drinking water treatment plant at Amsterdam water supply, Water Sci. Tech.-W. Sup., 4, 263–270, 2004.
Cromphout, J., Goethals, S., and Verdickt, L.: Optimization of the ozone dosage at the drinking water treatment plant of Kluizen, Water Sci. Tech.-W. Sup., 13, 1569–1575, https://doi.org/10.2166/ws.2013.170, 2013.
Eaton, A. D., Clesceri, L. S., Rice, E. W., Greenberg, A. E., and Franson, M. H.: Standard Methods for the Examination of Water and Wastewater, American Public Heath Association, Washington DC, United States, 2005.
Edzwald, J. K. and Tobiason, J. E.: Enhanced coagulation: US requirements and a broader view, Water Sci. Technol., 40, 63–70, 1999.
Elovitz, M. S., Von Gunten, U., and Kaiser, H. P.: Hydroxyl radical/ozone ratios during ozonation processes. II. The effect of temperature, pH, alkalinity, and DOM properties, Ozone: Science and Engineering, 22, 123–150, 2000.
Escobar, I. C., Randall, A. A., and Taylor, J. S.: Bacterial growth in distribution systems: Effect of assimilable organic carbon and biodegradable dissolved organic carbon, Environ. Sci. Technol., 35, 3442–3447, 2001.
Graveland, A.: Application of biological activated carbon filtration at Amsterdam water supply, Water Supply, 14, 233–241, 1996.
Gunatilaka, A. and Dreher, J.: Use of real-time data in environmental monitoring: Current practices, Water Sci. Technol., 47, 53–61, 2003.
Hall, J., Zaffiro, A. D., Marx, R. B., Kefauver, P. C., Radha Krishnan, E., Haught, R. C., and Herrmann, J. G.: On-line water quality parameters as indicators of distribution system contamination, J. Am. Water Works Ass., 99, 66–77, 2007.
Hammes, F. A. and Egli, T.: New method for assimilable organic carbon determination using flow-cytometric enumeration and a natural microbial consortium as inoculum, Environ. Sci. Technol., 39, 3289–3294, 2005.
Ikonen, J., Pitkänen, T., Kosse, P., Ciszek, R., Kolehmainen, M., and Miettinen, I. T.: On-line detection of Escherichia coli intrusion in a pilot-scale drinking water distribution system, J. Environ. Manage., 198, 384–392, https://doi.org/10.1016/j.jenvman.2017.04.090, 2017.
Jansen, H. W., Vroegindeweij, A., and Haijma, S.: The role of SCADA systems within integrated process control systems, Water Supply, 15, 43–53, 1997.
Juntunen, P., Liukkonen, M., Lehtola, M. J., and Hiltunen, Y.: Dynamic soft sensors for detecting factors affecting turbidity in drinking water, J. Hydroinform., 15, 416–426, https://doi.org/10.2166/hydro.2012.052, 2013.
Langergraber, G., Fleischmann, N., and Hofstädter, F.: A multivariate calibration procedure for UV/VIS spectrometric quantification of organic matter and nitrate in wastewater, Water Sci. Technol., 47, 63–71, 2003.
Lazarova, V. and Manem, J.: Biofilm characterization and activity analysis in water and wastewater treatment, Water Res., 29, 2227–2245, https://doi.org/10.1016/0043-1354(95)00054-o, 1995.
Molina, L. T. and Molina, M. J.: Absolute absorption cross sections of ozone in the 185–350 nm wavelength region, J. Geophys. Res., 91, 1450–514508, 1986.
Nopens, I., Benedetti, L., Jeppsson, U., Pons, M. N., Alex, J., Copp, J. B., Gernaey, K. V., Rosen, C., Steyer, J. P., and Vanrolleghem, P. A.: Benchmark Simulation Model No 2: Finalisation of plant layout and default control strategy, Water Sci. Technol., 62, 1967–1974, 2010.
Poch, M., Comas, J., Rodríguez-Roda, I., Sànchez-Marrè, M., and Cortés, U.: Designing and building real environmental decision support systems, Environ. Modell. Softw., 19, 857–873, https://doi.org/10.1016/j.envsoft.2003.03.007, 2004.
Rieger, L., Langergraber, G., Thomann, M., Fleischmann, N., and Siegrist, H.: Spectral in-situ analysis of NO2, NO3, COD, DOC and TSS in the effluent of a WWTP, Water Sci. Technol., 50, 143–152, 2004.
Roccaro, P., Chang, H.-S., Vagliasindi, F. G. A., and Korshin, G. V.: Differential absorbance study of effects of temperature on chlorine consumption and formation of disinfection by-products in chlorinated water, Water Res., 42, 1879–1888, https://doi.org/10.1016/j.watres.2007.11.013, 2008.
Ross, P. S., van der Helm, A. W. C., van den Broeke, J., and Rietveld, L. C.: On-line monitoring of ozonation through estimation of Ct value, bromate and AOC formation with UV/Vis spectrometry, Anal. Methods-UK, 8, 3148–3155, https://doi.org/10.1039/c5ay03308j, 2016.
Ross, P. S., van der Aa, L. T. J., van Dijk, T., and Rietveld, L. C.: Effects of water quality changes on performance of biological activated carbon (BAC) filtration, Sep. Purif. Technol., 212, 676–683, https://doi.org/10.1016/j.seppur.2018.11.072, 2019.
Schlegel, S. and Baumann, P.: Requirements with respect to on-line analyzers for N and P, Water Sci. Technol., 33, 139–146, https://doi.org/10.1016/0273-1223(96)00166-7, 1996.
Seredyńska-Sobecka, B., Tomaszewska, M., Janus, M., and Morawski, A. W.: Biological activation of carbon filters, Water Res., 40, 355–363, 2006.
Servais, P., Billen, G., and Bouillot, P.: Biological colonization of granular activated carbon filters in drinking- water treatment, J. Environ. Eng., 120, 888–899, 1994.
Sgroi, M., Anumol, T., Roccaro, P., Vagliasindi, F. G. A., and Snyder, S. A.: Modeling emerging contaminants breakthrough in packed bed adsorption columns by UV absorbance and fluorescing components of dissolved organic matter, Water Res., 145, 667–677, https://doi.org/10.1016/j.watres.2018.09.018, 2018.
Simpson, D. R.: Biofilm processes in biologically active carbon water purification, Water Res., 42, 2839–2848, 2008.
Sontheimer, H., Crittenden, J. C., and Summers, R. S.: Activated carbon for water treatment, 2nd ed., AWWA – DVGW Forschungssstelle Engler Bunte Institut, Karlsruhe, Germany, 1988.
Uhl, W. and Gimbel, R.: Dynamic modeling of ammonia removal at low temperatures in drinking water rapid filters, Water Sci. Technol., 41, 199–206, 2000.
USEPA: Guidance manual for compliance with the filtration and disinfection requirements for public water systems using surface water supplies, Washington D.C., 1989.
USEPA: Edition of the drinking water standards and health advisories table, EPA-822-F-18-001, Office of Water U.S. Environmental Protection Agency, Washington, DC, 2018.
van de Ven, W., Bakker, S., Wuestman, R., McEwan, M., Mazier, S., Bergmans, B., Ross, P., Rietveld, L., and van Schagen, K.: Quality control for groundwater treatment plant Oldeholtpade: strategies for modeling and process management, IWA World Water Congres and Exhibition, Montreal, Canada, 2010,
van den Broeke, J., Ross, P. S., van der Helm, A. W. C., Baars, E. T., and Rietveld, L. C.: Use of on-line UV/Vis-spectrometry in the measurement of dissolved ozone and AOC concentrations in drinking water treatment, Water Sci. Technol., 57, 1169–1175, 2008.
Van den Broeke, J., Carpentier, C., Moore, C., Carswell, L., Jonsson, J., Sivil, D., Rosen, J. S., Cade, L., Mofidi, A., Swartz, C., and Coomans, N.: Compedium of Sensors and Monitors and Their Use in the Global Water Industry, WERF Research Report Series, 13, https://doi.org/10.2166/9781780406695, 2014.
van der Aa, L. T. J., Rietveld, L. C., and van Dijk, J. C.: Effects of ozonation and temperature on the biodegradation of natural organic matter in biological granular activated carbon filters, Drink. Water Eng. Sci., 4, 25–35, https://doi.org/10.5194/dwes-4-25-2011, 2011.
van der Helm, A. W. C.: Integrated modeling of ozonation for optimization of drinking water treatment, PhD, Sanitary Engineering, Delft University of Technology, Delft, 151 pp., 2007.
van der Helm, A. W. C., Rietveld, L. C., Baars, E. T., Smeets, P. W. M. H., and van Dijk, J. C.: Modeling disinfection and by-product formation during the initial and the second phase of natural water ozonation in a pilot-scale plug flow reactor, J. Water Supply Res. T., 57, 435–449, 2008a.
van der Helm, A. W. C., Rietveld, L. C., Bosklopper, T. G. J., Kappelhof, J. W. N. M., and van Dijk, J. C.: Objectives for optimization and consequences for operation, design and concept of drinking water treatment plants, Water Sci. Tech.-W. Sup., 8, 297–304, 2008b.
van der Helm, A. W. C., van der Aa, L. T. J., van Schagen, K. M., and Rietveld, L. C.: Modeling of full-scale drinking water treatment plants with embedded plant control, Water Sci. Tech.-W. Sup., 9, 253–261, 2009.
van der Kooij, D.: Assimilable organic carbon as an indicator of bacterial regrowth, J. Am. Water Works Ass., 84, 57–65, 1992.
van der Kooij, D., Hijnen, W. A. M., and Kruithof, J. C.: Effects of ozonation, biological filtration and distribution on the concentration of easily assimilable organic carbon (AOC) in drinking water, Ozone-Sci. Eng., 11, 297–311, 1989.
van Schagen, K., Rietveld, L., Veersma, A., and Babuska, R.: Model-based pH monitor for sensor assessment, Water Sci. Technol., 60, 709–715, 2009.
van Schagen, K., Rietveld, L., Veersma, A., and Babuška, R.: Control-design methodology for drinking-water treatment processes, Water Sci. Tech.-W. Sup., 10, 121–127, 2010.
van Schagen, K. M.: Model-Based Control of Drinking-Water Treatment Plant PhD, Delft University of Technology, 2009.
van Schagen, K. M., Rietveld, L. C., and Babuška, R.: Dynamic modelling for optimisation of pellet softening, J. Water Supply Res. T., 57, 45–56, https://doi.org/10.2166/aqua.2008.097, 2008.
Vanrolleghem, P. A. and Lee, D. S.: On-line monitoring equipment for wastewater treatment processes: State of the art, Water Sci. Technol., 47, 1–34, 2003.
Verliefde, A., Cornelissen, E., Amy, G., Van der Bruggen, B., and van Dijk, H.: Priority organic micropollutants in water sources in Flanders and the Netherlands and assessment of removal possibilities with nanofiltration, Environ. Pollut., 146, 281–289, https://doi.org/10.1016/j.envpol.2006.01.051, 2007.
Vital, M., Dignum, M., Magic-Knezev, A., Ross, P., Rietveld, L., and Hammes, F.: Flow cytometry and adenosine tri-phosphate analysis: Alternative possibilities to evaluate major bacteriological changes in drinking water treatment and distribution systems, Water Res., 46, 4665–4676, 2012.
von Gunten, U.: Ozonation of drinking water: Part I. Oxidation kinetics and product formation, Water Res., 37, 1443–1467, 2003a.
von Gunten, U.: Ozonation of drinking water: Part II. Disinfection and by-product formation in presence of bromide, iodide or chlorine, Water Res., 37, 1469–1487, https://doi.org/10.1016/s0043-1354(02)00458-x, 2003b.
Westerhoff, P., Aiken, G., Amy, G., and Debroux, J.: Relationships between the structure of natural organic matter and its reactivity towards molecular ozone and hydroxyl radicals, Water Res., 33, 2265–2276, 1999.
WHO: Guidelines for Drinking Water Quality, Geneva, 2008.
Wiersema, Y.: Efficiency and efficacy of ozonation for disinfection at the Weesperkarspel drinking water treatment plant, MSc, Utrecht University, Utrecht, 2018.